Statistics on GaW

Word cloud based on the contents of GaW
GaW in numbers
- The GaW database contains 42,599 observations of activities carried out by women and men to support themselves and those close to them.
- Of these, 21 per cent were undertaken by women, 73 per cent by men and 7 per cent by people of unknown sex.
- 63 per cent of the observations come from court records, 22 per cent from account books and 16 per cent from other sources.
- 9 per cent of the observations come from the 16th century, 27 per cent from the 17th century, 35 per cent from the 18th century and 29 per cent from the 19th century.
(Updated in February 2024)
The chronological distribution of the material
Number of activites per decennia
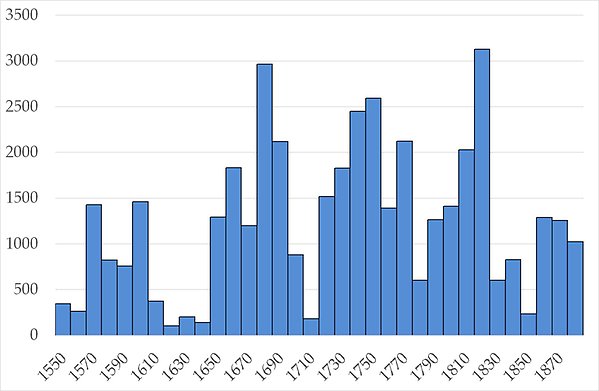
(Updated in February 2024)
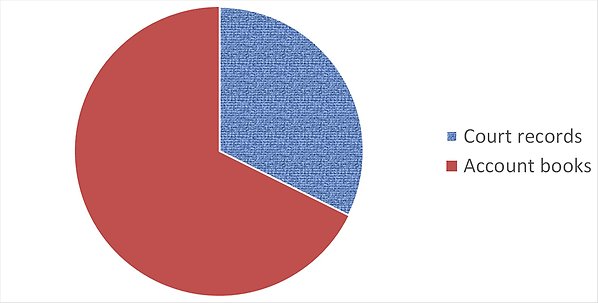
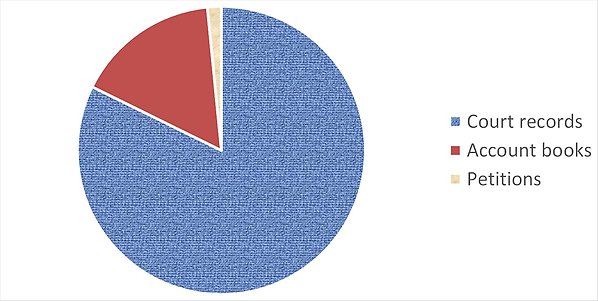
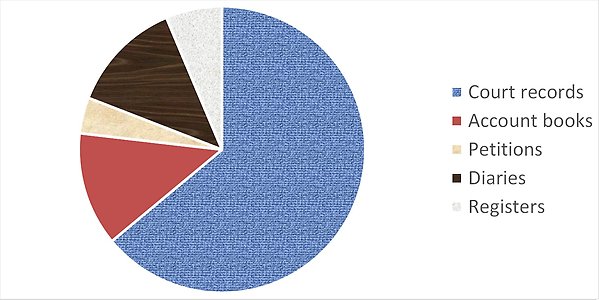
Activities grouped by type of source and period
1550-1599 (n = 3 624)
1600-1699 (n = 11 814)
1700-1799 (n = 14 933)
1800-1899 (n = 12 228)
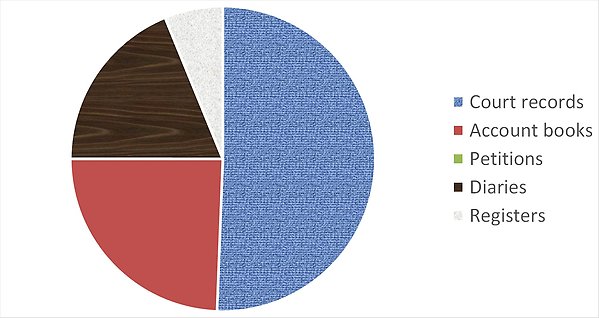
(Updated in February 2024)
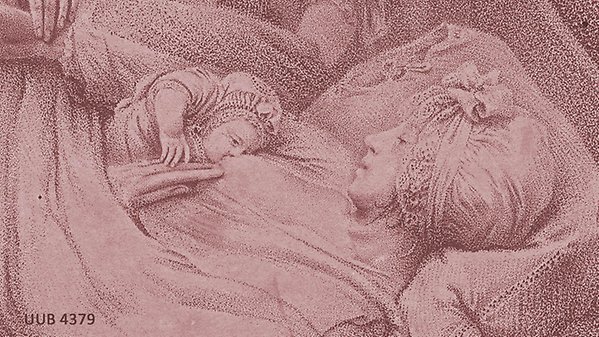
Categories with the greatest share of women
- Care (44%)
- Food and accommodation (43%)
- Other specified work (34%)
- Unspecified work (31%)
- Trade(29%)
Categories with the greatest share of men
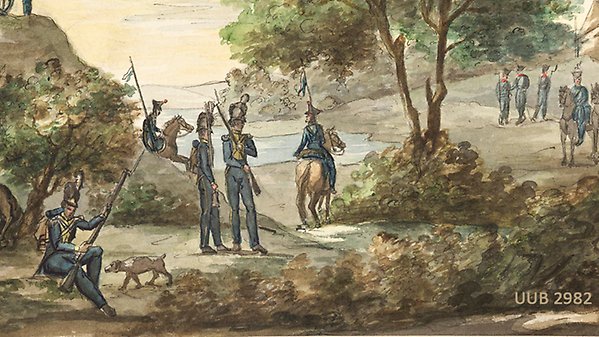
- Military (93%)
- Administration and justice (88%)
- Teaching (87%)
- Crafts and construction (79%)
- Hunting and fishing (77%)
