“We want to make it easier to visualize scientific data”
Hello there… Ingela Nyström, Professor in Visualization. You are the coordinator for Uppsala University in the national research infrastructure called InfraVis, which was recently granted SEK 160 million in funding as part of the Swedish Research Council’s call for Research infrastructure of national interest.
Uppsala University.
Photo: Kajsa Örjavik
What is InfraVis and why do we need this kind of research infrastructure?
“InfraVis is a new national research infrastructure for the visualization and analysis of scientific data. However, it is not made up of hardware in the form of computers and microscopes, but instead of expertise and people. We are offering visualization expertise to support other researchers. Nine higher education institutions are participating in InfraVis, with Chalmers University of Technology being the host university. InfraVis will have around 20 full-time posts divided among many individuals at various rates of engagement, including myself.
“Sweden needs this research infrastructure to make it easier for researchers to visualize scientific data and is part of efforts to strengthen Sweden’s competitiveness in the era of large-scale data.”
In what areas will you offer visualization support?
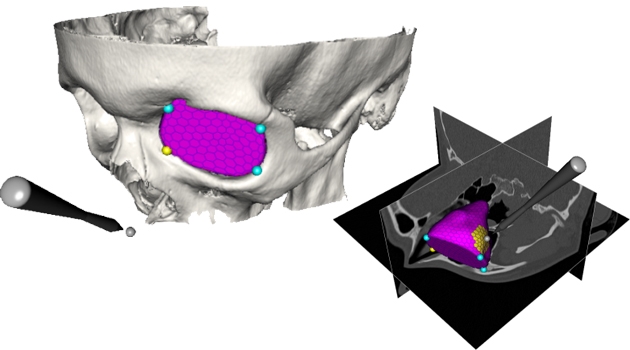
“InfraVis will offer expertise across a broad spectrum of areas. In my case, mainly in the visualization of medical data such as whole-body images or maxillo-facial parts. But it could be visualizing molecules in materials engineering, chemistry or pharmacy, or visualizing economic flows or data in the field of digital humanities. We welcome requests from all researchers in Sweden and in everything from humanities and archaeology to life sciences, medicine and engineering.
“There might be a researcher who extracts data from one of the beamlines at the MAX IV synchrotron radiation light source in Lund. When the researcher contacts InfraVis, they will be directed to a hub that keeps track of all visualization experts at the participating universities. The researcher is then put in contact with appropriate expertise and gets help in visualizing their data, for example, time flows or scales adapted to human colour perception.”
How does InfraVis connect with research at Uppsala University?
“We have a long history of research in visualization at Uppsala University linked to our Centre for Image Analysis that has had a variety of applications and focuses. Uppsala University’s participation in InfraVis is proof that we have strong research in visualization. Although the funding is there to support other researchers, I definitely believe that new ideas for research will be generated through the contacts coming thanks to InfraVis.”
What’s next for you?
“Currently, we are in the process of writing up agreements with the Swedish Research Council and between the higher education institutions. In November, we’ll have an internal kick-off and as of January 2022, visualization support will be up and running.
Photo: Uppsala University
“Something else that we are looking forward to a lot at Uppsala University is the move into our new facility New Ångström, where a new 100 square metre visualization theatre, Theatrum Visuale, is being built on the entrance floor. The room will have a four-metre ceiling height. The plan is to equip the theatre with advanced 3D technology for interactive teaching, research presentations, company and school visits and other activities. It will be a very exciting environment for our campus! I’m also looking forward to holding workshops for researchers from InfraVis across the nation in our theatre.”
Anneli Björkman
FACTS ABOUT INFRAVIS
InfraVis is a new national research infrastructure for the visualization of data granted close to SEK 80 million in funding from the Swedish Research Council for the years 2022–2026 in the call Research infrastructure of national interest in 2021 with equal co-financing from the participating higher education institutions. InfraVis will be managed by Chalmers University of Technology and includes the University of Gothenburg, KTH Royal Institute of Technology, Linköping University, Linnaeus University, Lund University, Mid Sweden University, Umeå University and Uppsala University. The strategic and scientific management of InfraVis includes representatives of the leading research environments in visualization located in Sweden and an international advisory committee.