
Researchers from Sweden and Canada are exploring a changing Arctic
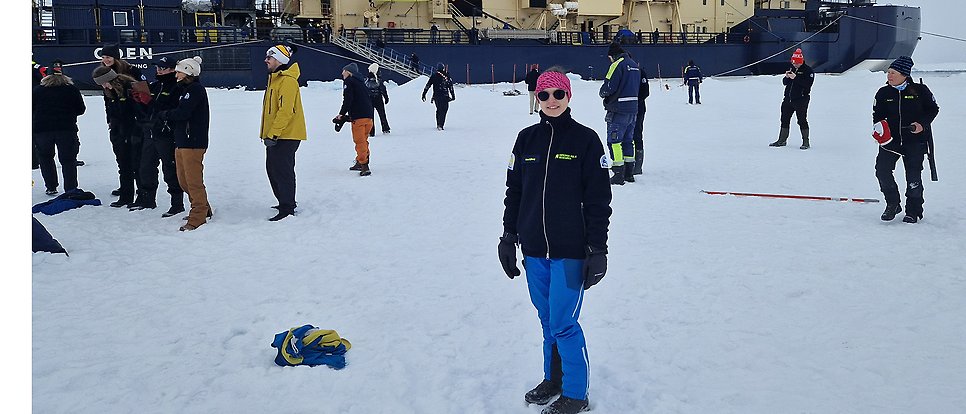
From 10 August to 20 September 2026, the icebreaker Oden will undertake an expedition with the Canadian Coast Guard Ship (CCGS) Louis S. St-Laurent to map the seabed in the Arctic Ocean. Moa Sjöberg, PhD student in Meteorology, is the only participant from Uppsala University.
Few places on Earth are changing as rapidly as the Arctic. The region is warming several times faster than the rest of the world, making it a key location for research into where the climate is heading. On 10 August, the Canada Sweden Arctic Ocean 2026 expedition set off, heading north towards the Arctic Ocean.

Moa Sjöberg, a PhD student at Uppsala University, is a member of the working group on sea ice properties. Her research focuses on the interaction between sea ice and the atmosphere, particularly smaller-scale processes in the Arctic that climate models struggle to capture.
The search for what climate models miss
The expedition is part of a three-year collaboration between Canada and Sweden. Two icebreakers are taking part: the Swedish Oden and the Canadian CCGS Louis S. St Laurent. Their joint mission is to map the seabed of the Arctic Ocean, with Longyearbyen in Svalbard as both the starting point and the destination. Part of the mapping is being carried out in accordance with Article 76 of the United Nations Convention on the Law of the Sea, which deals with how countries can determine the boundaries of their continental shelf.
On board the Oden, there is also a programme for early-career researchers, the Early Career Researcher Programme, which is running in parallel with the mapping. The programme consists of six different working groups featuring lectures and research discussions. What makes the programme unusual is that the researchers themselves have determined its content. Each participant was asked to submit their own proposal outlining what they wished to investigate and why they wanted to take part. As a result, the expedition covers a broader range of research questions than a typical research voyage.

The Arctic is one of the world’s most inaccessible and desolate environments. The polar bear is entirely dependent on sea ice to move around and hunt, making the species an important indicator of how rapidly the Arctic ecosystem is changing as the extent of the ice decreases.
Three-year collaboration between Canada and Sweden
The expedition is part of a three-year collaboration between Canada and Sweden. Two icebreakers are taking part: the Swedish Oden and the Canadian CCGS Louis S. St Laurent. Their joint mission is to map the seabed of the Arctic Ocean, with Longyearbyen in Svalbard as both the starting point and the end point. Part of the mapping is being carried out in accordance with Article 76 of the UN Convention on the Law of the Sea, which deals with how countries can determine the boundaries of their continental shelf.
On board the Oden, there is also a programme for early-career researchers, the Early Career Researcher Programme, which is running in parallel with the mapping. The programme consists of six different working groups featuring lectures and research discussions. What makes the programme unusual is that the researchers themselves have determined its content. Each participant was asked to submit their own proposal outlining what they wanted to investigate and why they wanted to take part. This means that the expedition covers a broader range of research questions than a typical research voyage. Moa Sjöberg, a PhD student in meteorology, is the only participant from Uppsala University..
What do you hope to discover?
- The resolution in regional and global weather and climate models is too coarse to describe all processes directly. The models divide the atmosphere and the ocean into grids, and what happens on a scale smaller than a grid cell simply cannot be calculated with sufficient clarity. But just because a process is not visible in the model does not mean it is insignificant; it still affects the weather and climate.
The solution is called parameterisation. Instead of describing exactly what happens at every point, the process’s overall, statistical effect across the entire grid cell is estimated. One example is sea ice. Current climate models describe it primarily in terms of the ice fraction – that is, the proportion of a model grid cell that is ice-covered. But not all ice is the same; it can be thick or thin, continuous or broken up into floes. In my research, I am investigating, amongst other things, whether we can incorporate more information than just the ice fraction, and thereby provide a better description of these processes. By being able to track the movement of the ice and measure wave energy, we can become even better at predicting how it will move in the future and how the ice will break up.
Moa has brought with her several OpenMetBuoys, which are deployed on the ice to record how it drifts, how the waves move and how the ice floes rotate. She has been able to purchase the buoys thanks to being awarded the Ymer Scholarship, a prize awarded by the Ymer-80 Foundation to young researchers to support polar research.
The timing is crucial. By the end of summer, the sea ice has melted throughout the season and is close to its lowest level of the year. The icebreakers began by heading straight for the North Pole, which they reached on 16 August, and then continued to cruise around the area.
What can OpenMetBuoys tell us that other measurements cannot?
- A particular challenge in the polar regions is the lack of measurements. The Arctic and Antarctic are simply not as easily accessible as other parts of the world; everything is a long way away, it is dark for half the year, and the cold and ice take a heavy toll on instruments.
OpenMetBuoys are small and practical and can be placed directly on the ice and then left there. They drift along with the ice and collect data over a long period. In this way, they can fill in gaps in our understanding of how the ice actually moves – information we need to improve the description of the ice in our models.
The team also measures the thickness of the ice and snow, the roughness of the ice floes and temperature differences. The aim is for each measuring station to provide as complete a picture of the ice as possible.
What do you hope the data you collect will contribute?
- I hope to be able to use buoy data as a sort of reference when training models to predict ice drift and to obtain information on, amongst other things, wave spectra. By combining buoy data with satellite data, I can also teach the models to extract more information from the satellite images. This gives the models more information to work from and can make them better at predicting how the ice moves.

The team measures ice thickness, snow depth, the unevenness of the ice floes and temperature differences, so that each ice station provides as complete a picture as possible. From the left, Chimira Andres; in the middle, Faustine Mascaut and Moa Sjöberg.
Is there anything you’ve seen or experienced during the expedition that has made you think differently about your own research?
- Yes, absolutely. Everyone here works with the Arctic in one way or another. By talking to others, I’ve come up with several ideas about how we could collaborate or link different areas of work together. I’ve also realised just how much I enjoy being out on the ice collecting data.
Links
Read more about the expedition here: https://www.polar.se/en/expeditions/canada-sweden-arctic-ocean-2026/